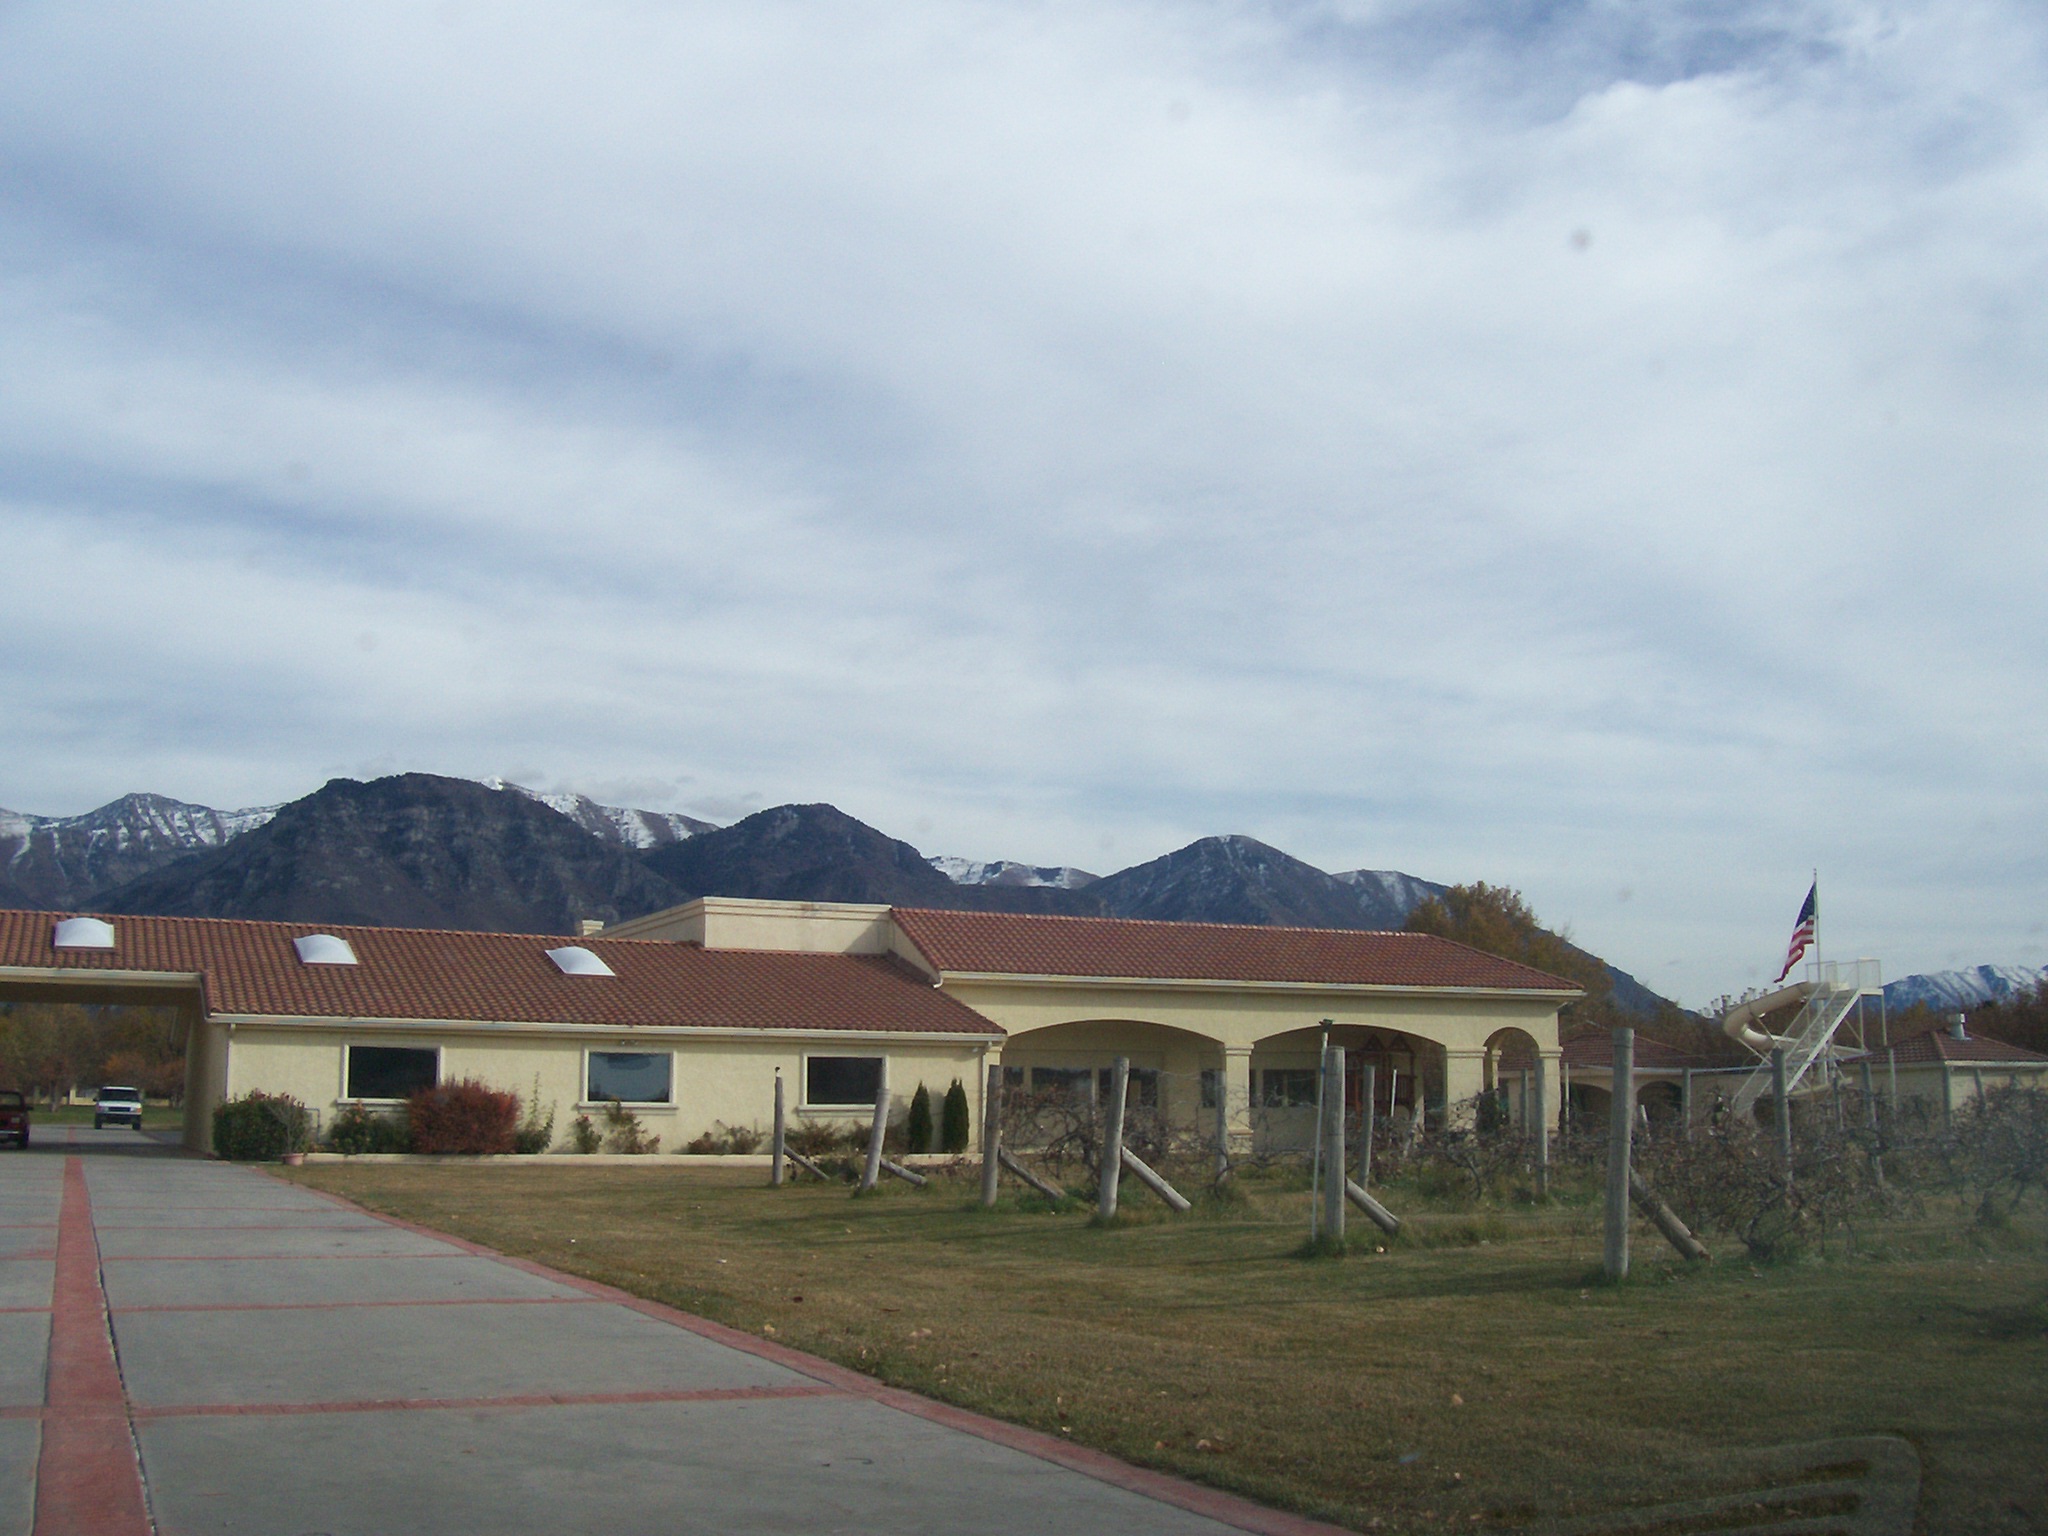
Valuation History for Serial Number 19:010:0090
----- Real Estate Values ----- |
---Improvements--- |
---Greenbelt--- |
Total |
|||||||||
| Year | Com |
Res |
Agr |
Tot |
Com |
Res |
Agr |
Tot |
Land |
Homesite |
Tot |
Market Value |
| 2016 | $0 |
$100,000 |
$323,700 |
$423,700 |
$0 |
$2,517,000 |
$0 |
$2,517,000 |
$4,642 |
$50,000 |
$54,642 |
$2,940,700 |
| 2015 | $0 |
$100,000 |
$323,700 |
$423,700 |
$0 |
$2,517,000 |
$0 |
$2,517,000 |
$4,627 |
$50,000 |
$54,627 |
$2,940,700 |
| 2014 | $0 |
$103,000 |
$258,900 |
$361,900 |
$0 |
$2,188,700 |
$0 |
$2,188,700 |
$4,666 |
$50,000 |
$54,666 |
$2,550,600 |
| 2013 | $0 |
$117,000 |
$258,900 |
$375,900 |
$0 |
$1,930,900 |
$0 |
$1,930,900 |
$4,901 |
$50,000 |
$54,901 |
$2,306,800 |
| 2012 | $0 |
$110,000 |
$194,200 |
$304,200 |
$0 |
$2,169,600 |
$0 |
$2,169,600 |
$4,851 |
$50,000 |
$54,851 |
$2,473,800 |
| 2011 | $0 |
$160,800 |
$279,504 |
$440,304 |
$0 |
$2,058,400 |
$0 |
$2,058,400 |
$4,861 |
$50,000 |
$54,861 |
$2,498,704 |
