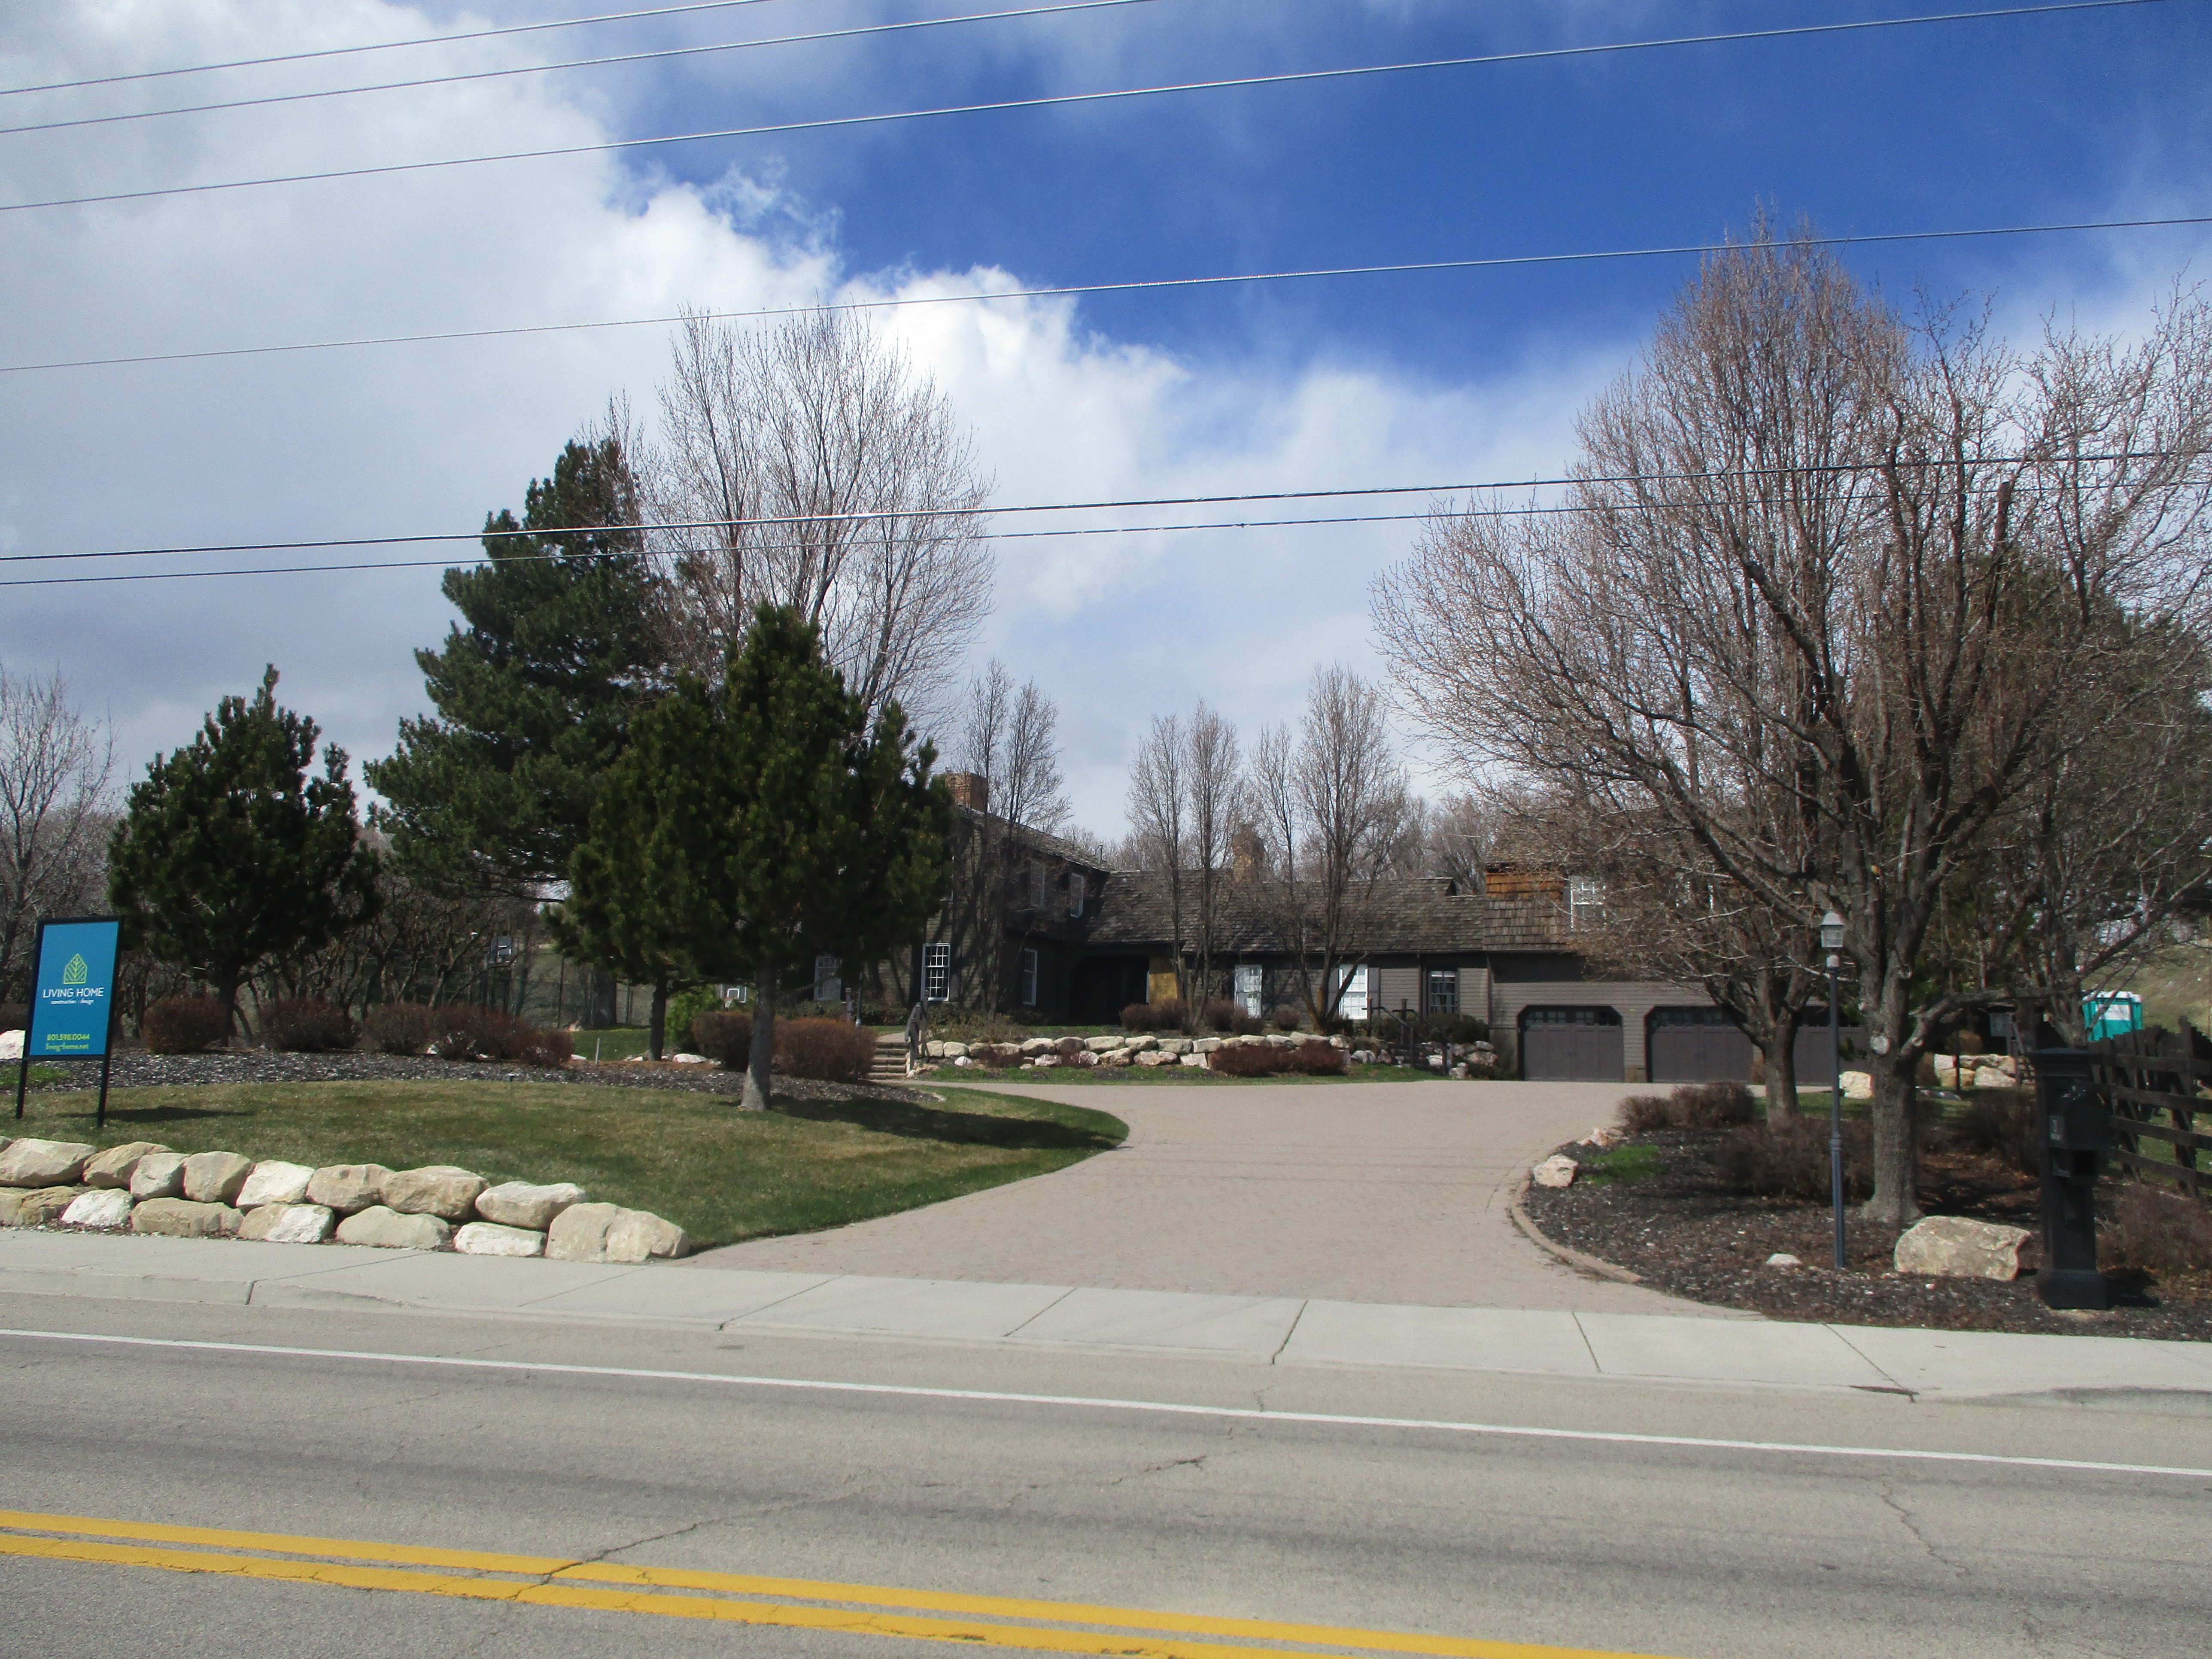
Valuation History for Serial Number 11:018:0135
----- Real Estate Values ----- |
---Improvements--- |
---Greenbelt--- |
Total |
|||||||||
| Year | Com |
Res |
Agr |
Tot |
Com |
Res |
Agr |
Tot |
Land |
Homesite |
Tot |
Market Value |
| 2024 | $0 |
$466,400 |
$202,500 |
$668,900 |
$0 |
$520,600 |
$0 |
$520,600 |
$0 |
$0 |
$0 |
$1,189,500 |
| 2023 | $0 |
$466,400 |
$202,500 |
$668,900 |
$0 |
$520,600 |
$0 |
$520,600 |
$0 |
$0 |
$0 |
$1,189,500 |
| 2022 | $0 |
$488,800 |
$212,200 |
$701,000 |
$0 |
$423,100 |
$0 |
$423,100 |
$0 |
$0 |
$0 |
$1,124,100 |
| 2021 | $0 |
$287,500 |
$124,800 |
$412,300 |
$0 |
$344,000 |
$0 |
$344,000 |
$0 |
$0 |
$0 |
$756,300 |
| 2020 | $0 |
$250,000 |
$108,500 |
$358,500 |
$0 |
$327,600 |
$0 |
$327,600 |
$0 |
$0 |
$0 |
$686,100 |
| 2019 | $0 |
$250,000 |
$108,500 |
$358,500 |
$0 |
$292,200 |
$0 |
$292,200 |
$0 |
$0 |
$0 |
$650,700 |
