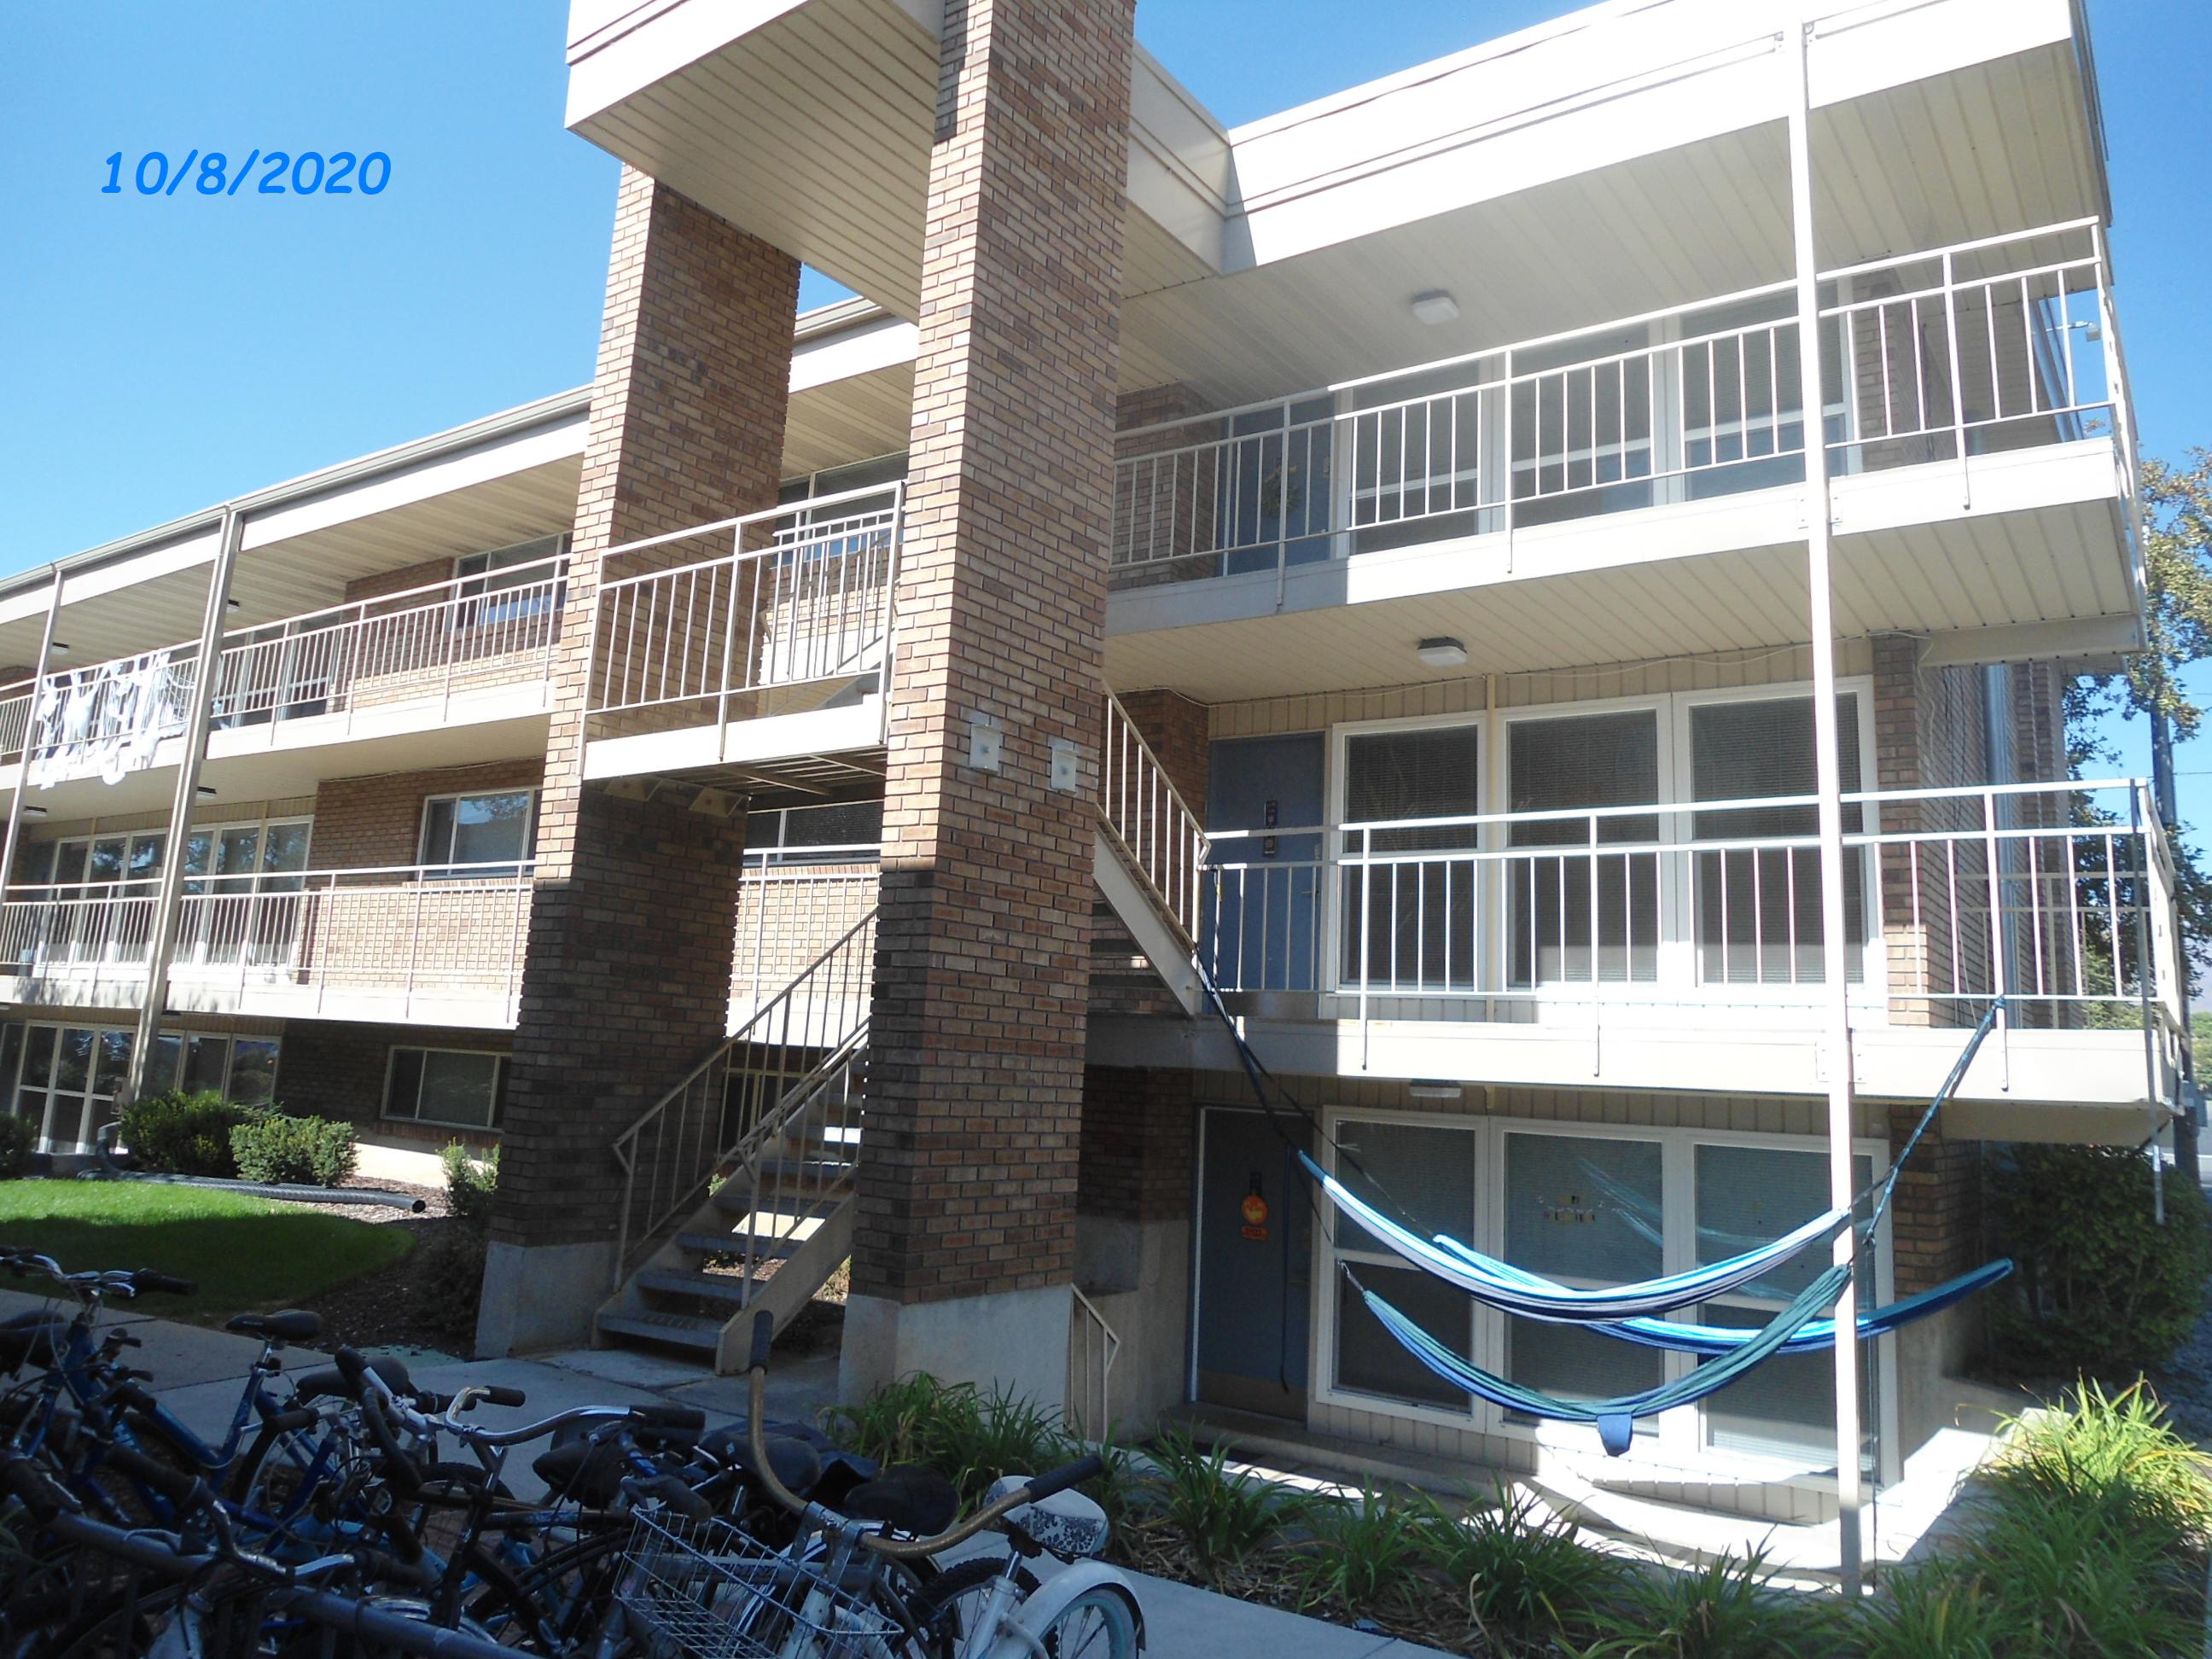
Valuation History for Serial Number 19:071:0067
----- Real Estate Values ----- |
---Improvements--- |
---Greenbelt--- |
Total |
|||||||||
| Year | Com |
Res |
Agr |
Tot |
Com |
Res |
Agr |
Tot |
Land |
Homesite |
Tot |
Market Value |
| 2023 | $0 |
$3,589,700 |
$0 |
$3,589,700 |
$0 |
$16,353,100 |
$0 |
$16,353,100 |
$0 |
$0 |
$0 |
$19,942,800 |
| 2022 | $0 |
$3,589,700 |
$0 |
$3,589,700 |
$0 |
$16,353,100 |
$0 |
$16,353,100 |
$0 |
$0 |
$0 |
$19,942,800 |
| 2021 | $0 |
$3,241,500 |
$0 |
$3,241,500 |
$0 |
$14,100,100 |
$0 |
$14,100,100 |
$0 |
$0 |
$0 |
$17,341,600 |
| 2020 | $0 |
$3,087,200 |
$0 |
$3,087,200 |
$0 |
$13,428,700 |
$0 |
$13,428,700 |
$0 |
$0 |
$0 |
$16,515,900 |
| 2019 | $0 |
$3,176,200 |
$0 |
$3,176,200 |
$0 |
$12,704,600 |
$0 |
$12,704,600 |
$0 |
$0 |
$0 |
$15,880,800 |
| 2018 | $0 |
$2,646,800 |
$0 |
$2,646,800 |
$0 |
$12,057,600 |
$0 |
$12,057,600 |
$0 |
$0 |
$0 |
$14,704,400 |
